
Monarch, YNAB and the Amazon Black Box
The short version: Your bank statement says “AMZN Mktp US*2K4TX9.” It does not say “batteries, a phone case, and a lamp nobody asked for.” Budgeting apps like Monarch and YNAB are great at the charge and mostly blind to what's inside it. Here's how to open the box using data Amazon already hands you, a Google Sheet, and about 15 minutes of actual work.
Why I'm writing this (the kids-and-cardboard edition)
Hi, I'm Michael. I live at the base of Pikes Peak, I've done zero-based budgeting for close to a decade, and I have young kids. At my house, Amazon isn't a store. It's a utility, like water, except it arrives in boxes.
Zero-based budgeting means every dollar gets a job before the month starts. I love it. It has exactly one weakness: you can't give a dollar a job if you don't know what it did last month. And every month, one line stared back at me like a locked door. Amazon. A big round number. No explanation.
I'm an engineer and project manager by trade. I've spent years building automation around six-figure budgets, and my professional instincts boil down to one rule: if you can't see inside it, you can't manage it. I tried the big budgeting apps, YNAB among them. They're good. They just couldn't tell me what was in the box.
So I did what any reasonable dad with a spreadsheet habit would do. I built something. This post is the how-to, plus an honest tour of the options, including the ones that aren't mine.
The problem: your budgeting app sees the charge, not the cart
Here's what happens when you buy something on Amazon. Your bank sees one number going to one merchant and passes it to your budgeting app. The app has no idea whether that $87.43 was diapers, a drill, or three birthday presents. Multiply that by a year of orders and your biggest budget category is also the one you understand least.
Your budget sees a box.
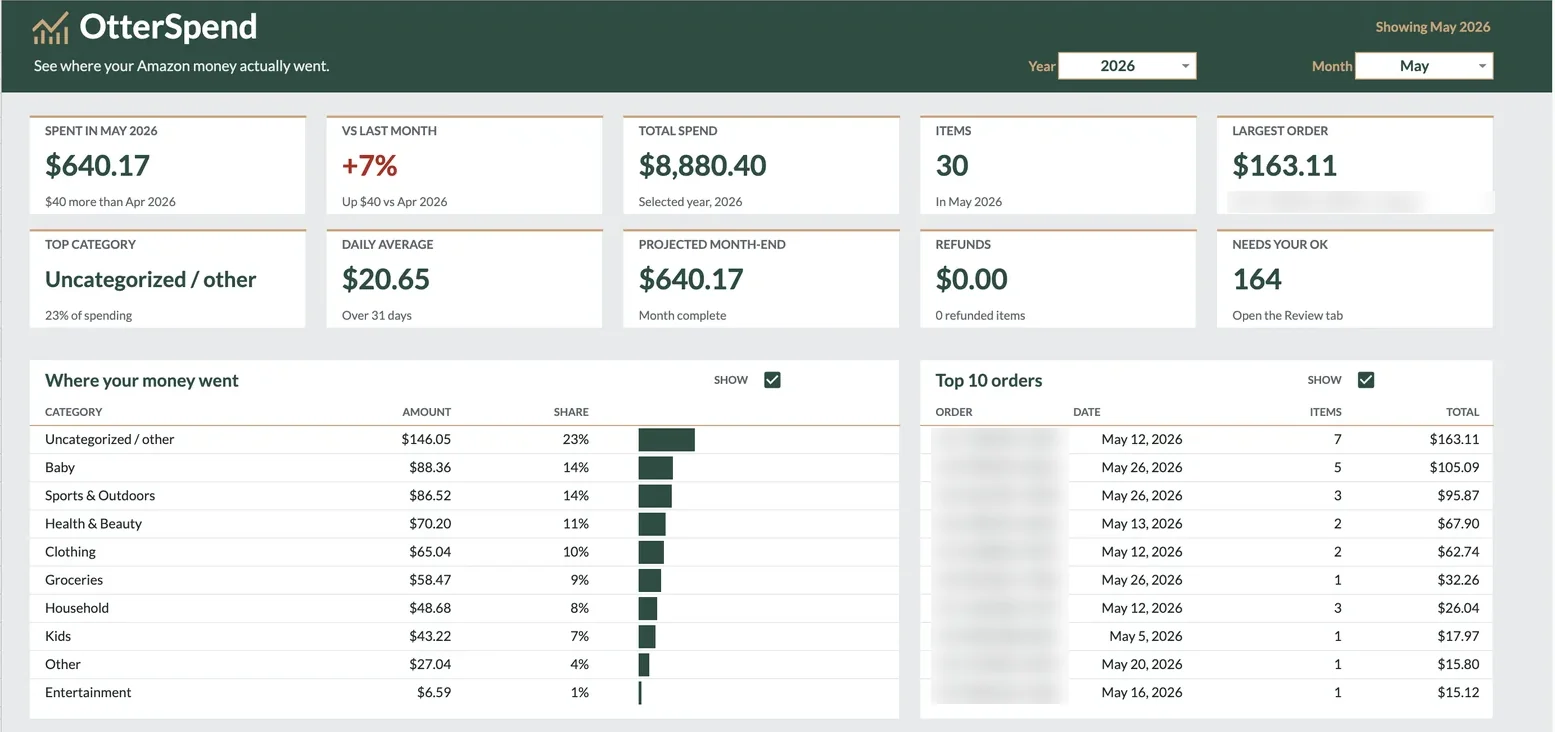
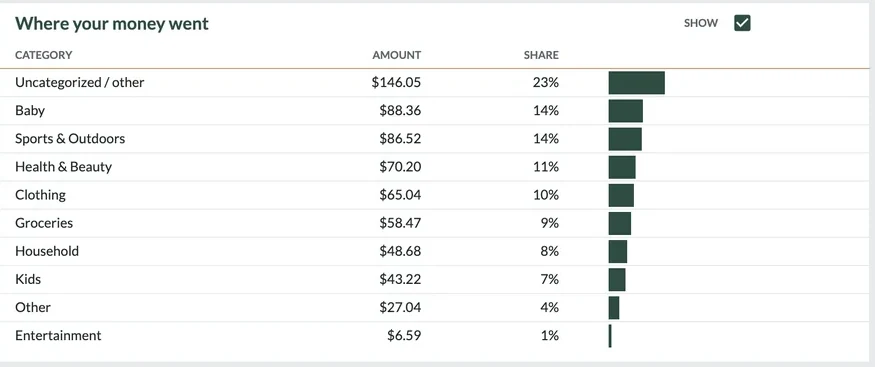
OtterSpend sees what's inside.
What your budgeting app sees
Five items. One number. Zero clues.
OtterSpend, same charge
Here's where the two big names stand today:
- YNAB lets you split a transaction across categories, but you type every split yourself. Its help page on splits doesn't describe any automatic Amazon itemizing.
- Monarch added a fix in 2025. Its Chrome extension syncs your Amazon orders, then splits and recategorizes the matching transactions. If you already pay for Monarch and use Chrome, try it first. It's a real solution.
It does come with limits. Per Monarch, it covers Amazon US only, needs a Chrome-based browser, syncs the last three months at first (older orders are a manual backfill), and doesn't categorize refunds yet. One independent review adds that it syncs one Amazon account at a time and skips Whole Foods, Amazon Fresh and Kindle purchases. Details like these change, so check Monarch's current docs. The extension's store listing also says it uses AI to process receipt data and passes along item names, merchants, prices and dates.
So every route so far means manual work, a subscription, or a browser extension reading your Amazon account. There's a fourth way: ask Amazon for your own data and look at it yourself.
How to see inside your Amazon spending
You need a Google account, about 15 minutes, and some patience for Amazon, which can take a few days to prepare your data. Request it first, then do the rest while you wait.
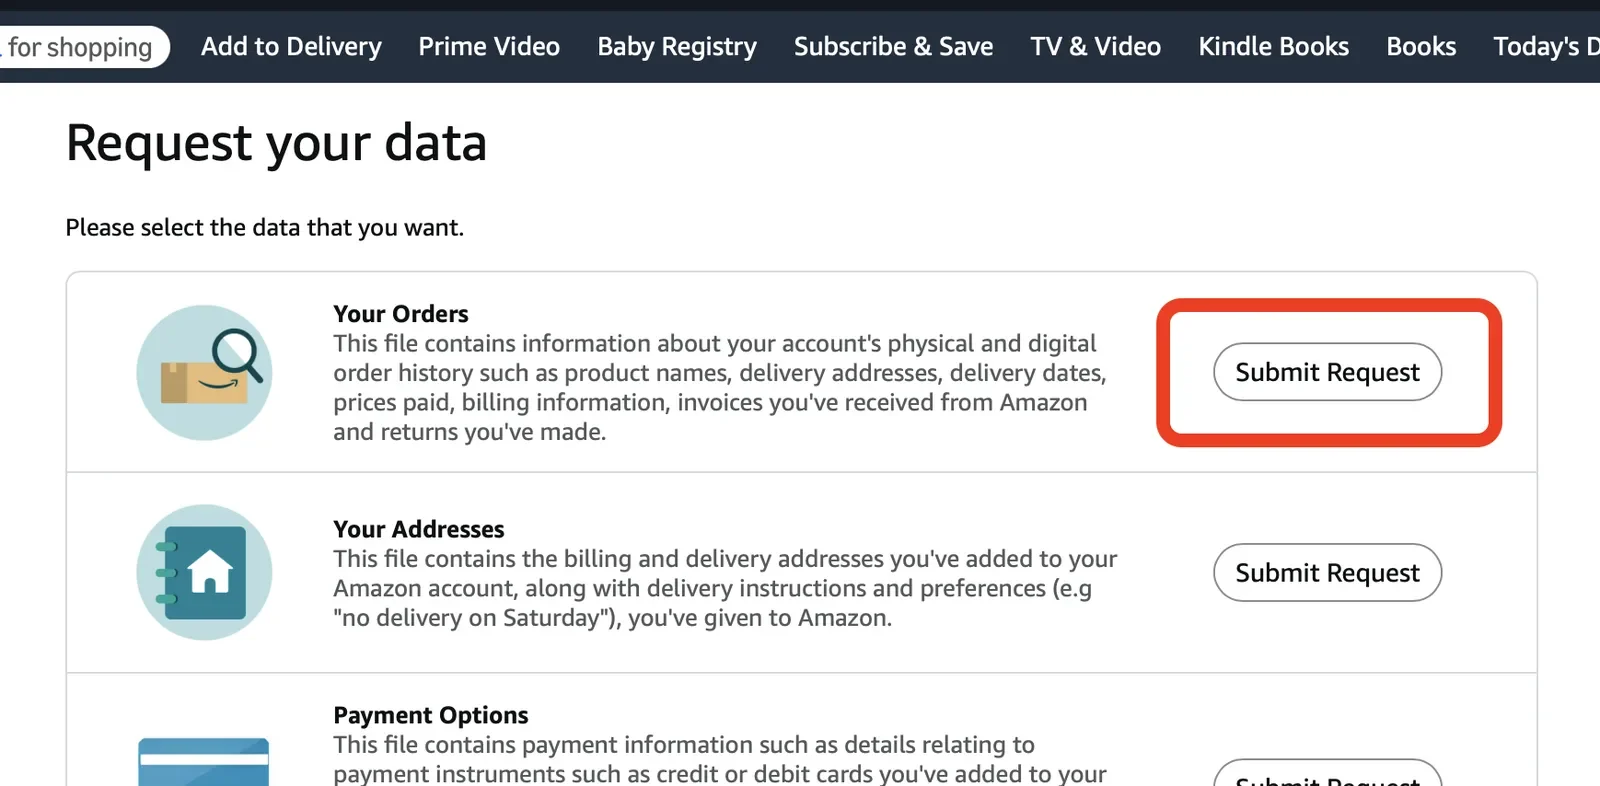
- Ask Amazon for your orders. Sign in at amazon.com, go to Account & Lists, then Account, then Data and privacy, and choose Request your data (or go straight to amazon.com/hz/privacy-central/data-requests). Select only Your Orders, which is faster and less likely to fail than requesting everything. Confirm the email Amazon sends you.
- Wait, then download the ZIP. It usually takes one to three days, though big accounts can take longer. Download it promptly, because the link expires.
- Find the good file. Inside the ZIP,
Your Orders/Order History.csvhas one row per item: date, product name, quantity, price and status. - Open it in Google Sheets (File, Import, Upload). Keep Order Date, Product Name, Quantity, Unit Price and Order Status, and delete the rest. Add a Line Total column (quantity times unit price) and filter out cancelled orders.
- Give every item a category. Make a second tab called Rules with keywords in column A (“diaper”, “batteries”, “shampoo”) and categories in column B. Put your most specific keywords first, because the first match wins. Then add a Category column with this formula, where B2 is the first product name and the Rules range covers exactly the rows you filled (a blank row in the range would match everything):
=ARRAYFORMULA(IFERROR(INDEX(Rules!$B$2:$B$40, MATCH(TRUE, ISNUMBER(SEARCH(Rules!$A$2:$A$40, B2)), 0)), "Review")) - Pivot it. Insert, then Pivot table: rows are Category, columns are month, values are the sum of Line Total. That's your answer.
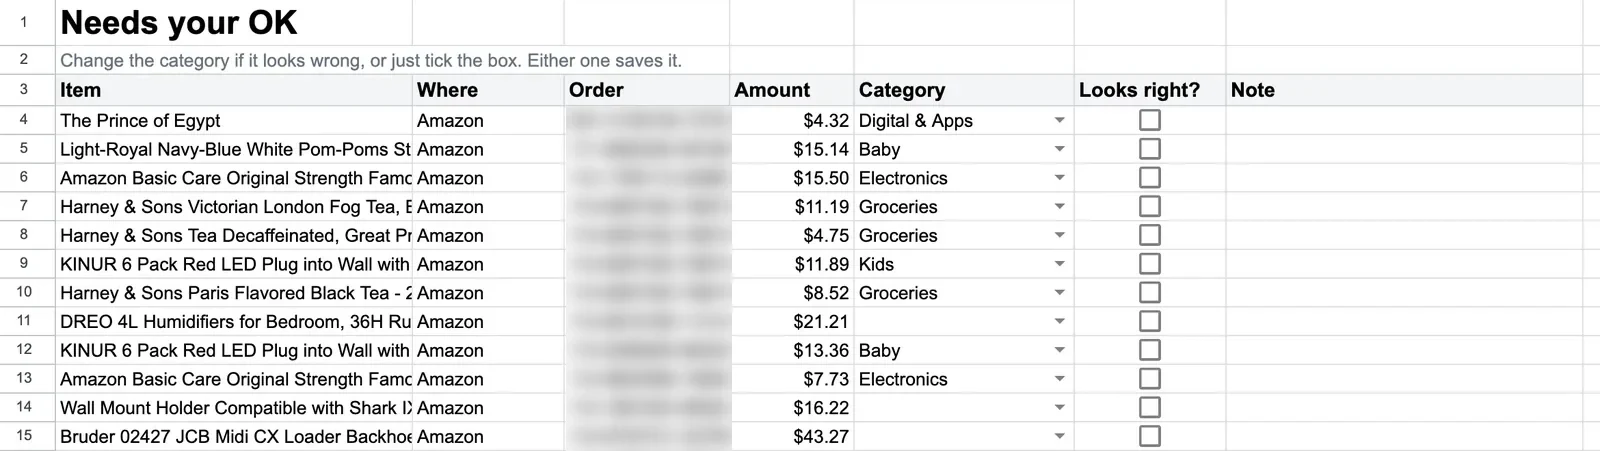
The honest warning: this works, and it's free. It's also a hobby. A few years of orders means thousands of rows, a rules list that never stops growing, and no refund matching unless you build it yourself. In a real order history I looked at, 15% of the items came out of Amazon's export with no usable department at all. That gap is why I built OtterSpend.
What 16 years of Amazon orders looks like
I went through a real Amazon order history that stretches back 16 years. Here's the damage.
| What I counted | The number |
|---|---|
| Years of order history | 16 (Aug 2010 to Jul 2026) |
| Orders | 2,237 |
| Individual items | 4,174 |
| Different products | 2,950 |
| Total purchases, before tax | About $88,700 |
| Median item price | $14.99 |
| Priciest single item | $509.95 |
| Items with no department in Amazon's export | 627 (15%) |
No single purchase did the damage. The typical item cost $14.99, and the priciest was about $510. It was 4,174 small decisions, and 2020 did a lot of the lifting: spending jumped from about $4,300 in 2019 to about $10,300, more than double.
That's the thing about Amazon spending. It never feels like a big purchase. It feels like a $14.99 purchase, repeated until it becomes a car payment.
Or skip steps 3 to 6: OtterSpend
If building a rules list sounds like someone else's idea of a fun Saturday, that's why I built OtterSpend. It's the same method, already assembled, in a Google Sheet that runs in your own Google account.
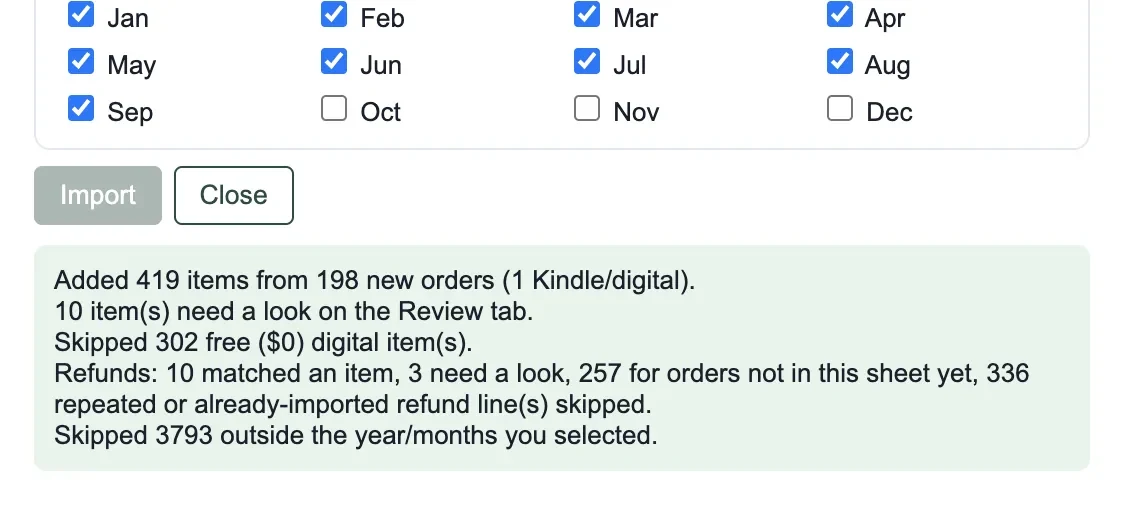
- Reads your Amazon order file (or the whole ZIP), including Kindle and digital orders and returns
- Sorts every item into 24 categories using about 1,360 keyword rules
- Matches refunds and returns to the original items
- Asks you to confirm anything it's unsure about, then remembers your choice
- Exports your itemized data to CSV whenever you want
- Sends nothing to an outside server
Here's how the options stack up:
| Option | Itemizes Amazon? | Effort | Cost model | Where your data lives |
|---|---|---|---|---|
| YNAB | Only if you split by hand | Manual, per transaction | Subscription | YNAB's servers |
| Monarch | Yes, through its Chrome extension (Amazon US) | Install the extension, keep the browser open for auto-sync | Subscription | Monarch's servers |
| DIY Google Sheet | Yes, if you build the rules | Hours, plus upkeep | Free | Your Google Drive |
| OtterSpend | Yes, from Amazon's own data export | About 15 minutes, plus Amazon's wait | $12.99, once | Your Google Drive |
One-time purchase. No subscription. The next time Amazon shows you a big round number, you'll know exactly what's in the box.
Get OtterSpend on Payhip Get it on EtsyQuick questions
Is it safe?
OtterSpend runs inside your own copy of the sheet in your own Google account. Google shows a “hasn't verified this app” warning because it's a private script, not a store app. It reads and writes only that spreadsheet, and nothing goes to an outside server.
Should I just use Monarch?
If you already pay for it, use Chrome and shop on Amazon US, try its extension first. If you'd rather not add an extension, want your full history, or want your data to stay in your own Drive, that's where OtterSpend fits.
What about returns?
Returns and refunds are matched to the original items. Digital returns aren't matched yet.
How far back can I go?
A sheet holds about 3,000 items, so for a long history you import by year and month. Most people care about the last year or two anyway.
Does it work on my phone?
You can view the dashboards in the Google Sheets app, but import and export need a computer.
What stores and currencies?
US dollars and amazon.com orders only, for now.
What does it cost?
$12.99 once. No subscription.
Sources
- Monarch: Amazon sync extension announcement
- Monarch retail purchase sync, Chrome Web Store listing
- Independent review of Monarch's Amazon sync
- YNAB: split transactions guide
- How to download your Amazon data
Checked October 23, 2026. Monarch and YNAB are trademarks of their owners. Peak Otter is not affiliated with either.